A New Update on Global Electronic Waste
Ever wonder what happens to all those laptops, cell phones, refrigerators, and other electrical and electronic devices that have reached the end of their useful lives?

A New Update on Global Electronic Waste: Three-Quarters Goes to Unknown Destinations

Ever wonder what happens to all those laptops, cell phones, refrigerators, and other electrical and electronic devices that have reached the end of their useful lives?
The United Nations University, together with the International Telecommunications Union and International Solid Waste Association, has just released its 2017 e-Waste report covering data through 2016, that provides a fascinating look at an over-overlooked aspect of high technology.
Almost 45 million tonnes (44.7 Mt) of electronic waste, or e-waste, was generated worldwide in 2016, up 7.6 percent from 41.8 Mt in 2014. That works out to just over 6 kg per inhabitant, an increase of about 1.5 percent from 2015. It’s also, as the report notes, the equivalent of 4500 Eiffel Towers’ worth of material – including everything from heat pumps and clothes washers to electronic toys and desktop video cameras.
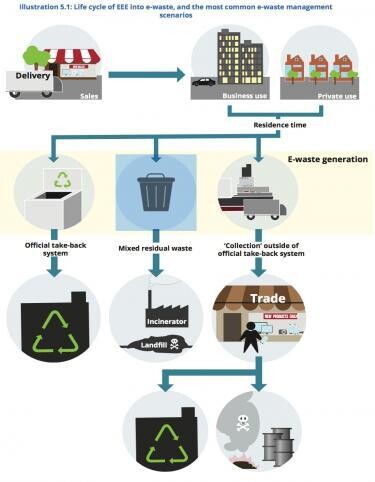
The report estimates that some 20 percent of this e-waste is “collected and properly recycled,” and another 4 percent goes to residual waste in OECD countries, probably either landfilled or incinerated. That leaves 76 percent that goes who-knows-where - a huge gap, that implies substantial waste of reusable materials and pollution from improper disposal. We could use better accountability, and better mechanisms both for uptake and incentivisation. The report also emphasized the need for better data and statistics.
Interestingly, the report authors estimate that approximately €55 billion in raw materials was wasted in 2016, based on the "potential value" of the raw materials embodied in the e-waste. That’s a significant amount of money to just throw away, and we think it illustrates quite clearly why practitioners and sustainability professionals need to bring a long-term, circular perspective into their analyses - what we call the wasted resource or Ideal World allocation. This should provide some very effective incentive for firms, at least, to increase e-waste recovery and hopefully continue to drive improvement.
There is a bright spot amongst the analysis. Back in 2015, the group estimated that e-waste would reach 50Mt in 2018, but the 2016 report now says that level won’t be reached until 2020. That's in part because the number of countries with e-waste legislation has grown by 10 percent, from 51 in 2014 to 67 in 2017 - including those that had the highest rates of e-waste generation. In aggregate, that increases the fraction of the global population covered by "e-waste management laws" from 44% to 66%.
We can all do a bit more as consumers, too. Find and use the e-waste collection points in your area, many of which are in consumer electronics shops. In the US, Best Buy and Staples both have collection points – so take your old items with you when you go shopping!
Sources:
Report page, which has some nice graphics illustrating key findings
2017 UNU Report (UNU, International Telecommunications Union, International Solid Waste Association)
2014 UNU, ITU, ISWA report - Global e-waste monitor 2014 (published in 2015)